Statistical significance tells you whether the result from an experiment is likely attributable to the specific change you did. It’s an essential quantification when running app experiments, and it prevents you from concluding too early about a change you’ve made.
I’ve been running hundreds of experiments throughout my career and only a few of the platforms I’ve used indicated whether an experiment result was statistically significant. In other words, many tools make you think your change had a positive effect, while it might have just been a coincidence. Let’s dive into what it means and how you can verify experiments manually.
What is statistical significance?
When an app experiment becomes statistically significant, you can conclude that the results aren’t coincidental but caused by a specific improvement.
Simply put, you could look at the results of an experiment when ten users entered your variant and conclude you’ve improved your app. However, with only ten users in your funnel, it’s impossible to conclude the results aren’t just a coincidence.
Why should you bother about statistical significance?
You’re running experiments to improve a certain metric or flow in your app. For example, you could be trying to increase the install-to-trial conversion rate, which could impact your business’s revenue. If you’re getting false positives out of experiments, you could negatively impact revenue, which can have a significant impact.
Statistical significance prevents you from making data-driven decisions based on assumptions. Instead, you can trustfully conclude whether an experiment resulted in an improvement or not.
How do I verify whether my experiment is statistically significant?
Hopefully, you’re using an experimentation tool that shows whether your experiment is statistically significant. In case you don’t, you can calculate the result manually using online calculators.
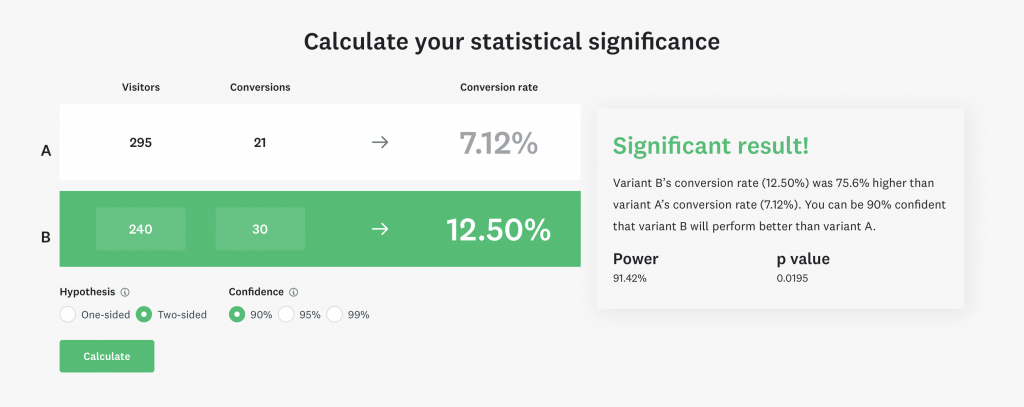
One of the tools I like to use is this one from SurveyMonkey:

The calculator requires you to fill in a few details:
- The number of visitors for each variant. In my case, I’ve had 295 users ending up in the control group versus 240 in the variant.
- How many users converted? In my example, I looked at the initial install-to-trial conversion for an experiment inside RocketSim.
- Hypothesis: could your variant have a negative impact (two-sided) or only positive?
- Confidence: how confident do you want to be about the experiment’s impact?
The confidence level is interesting. I’ve selected 90%, meaning I want to be 90% sure that my variant has positively impacted my app. Small apps like mine only have a few thousand users, making it hard to get to a 99% confidence level quickly. The higher your confidence target, the more users you’ll need to exclude a result of coincidence.
Some experts argue that you should make bold decisions for smaller apps since it’s hard to reach proper conclusions with A/B tests. However, I like to always have some kind of confidence level, for which this tool works great.
Conclusion
App experiments are great, but only if you conclude on results with statistical significance. False positives can directly impact your app’s revenue, potentially causing worse business results. Since not all experiment tools provide these insights, it’s important to know how to calculate how confident you can be about the results manually.
If you like to prepare and optimize, even more, check out the optimization category page. Feel free to contact me or tweet me on Twitter if you have any additional tips or feedback.
Thanks!