Xcode breakpoints allow us to debug and find out solutions for nasty bugs. Without breakpoints, it would be a fun fest with a lot of print statements everywhere in your code. The basic principles of breakpoints we probably all know but there’s a lot more to discover!
What are breakpoints in Xcode?
A breakpoint can be placed at a certain line of code and pauses your app during execution in order to inspect the state of your app at that point. Breakpoints can be set at any time, before and while your app is running.
An overview can be found within the breakpoint navigator which shows all activated and disabled breakpoints. The debug bar contains a breakpoint activation button to temporary disable breakpoints from pausing your app.

1: User-defined breakpoints
One of the few things you might do for every new Xcode project you create is adding those handy breakpoints that helped you debug a lot of bugs. This is a redundant process and can be solved with user-defined breakpoints in Xcode.

Once you moved a breakpoint it will be shown in its own section containing all user-defined breakpoints.

This will make your breakpoint available in each Xcode project you open. This includes projects created by you as well as projects downloaded from the internet. Any project!
2: Sharing breakpoints through GIT
Sometimes you find yourself looking at your colleague’s workflow and you realize he has some great and useful defined breakpoints. Instead of asking him about instructions to set up the same breakpoints you can ask him to share them through GIT.

This will move the breakpoint to its own section with shared breakpoints. This makes it really easy to get an overview of all shared breakpoints.

As the breakpoints are shared it’s also a shared responsibility to keep them alive. Therefore, if one of your colleagues decides to remove the breakpoint it will also be removed from your breakpoints list as soon as you pull the latest changes from GIT.
3: Exception breakpoints with a debugger command action
One of the user-defined breakpoints I’ve been using for years now is the exception breakpoint. An exception breakpoint is triggered when a specific type of exception is thrown or caught. Whenever the exception breakpoint would hit I would immediately type in the po $arg1 statement after clicking on objc_exception_throw to get more information about the thrown exception:
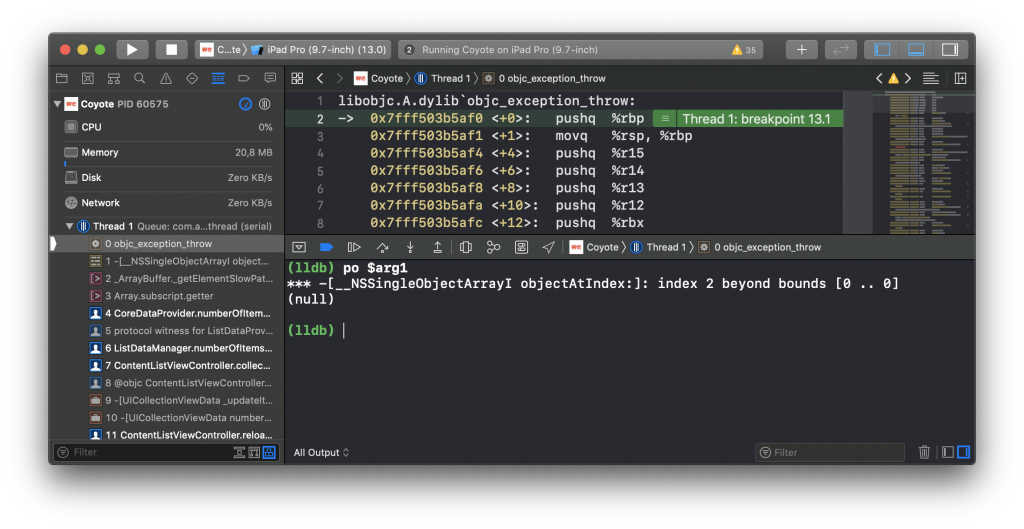
This can be easily automated using a defined action in your breakpoint. Any defined actions will be executed at the moment a breakpoint is hit and can be a valuable way to debug your application.
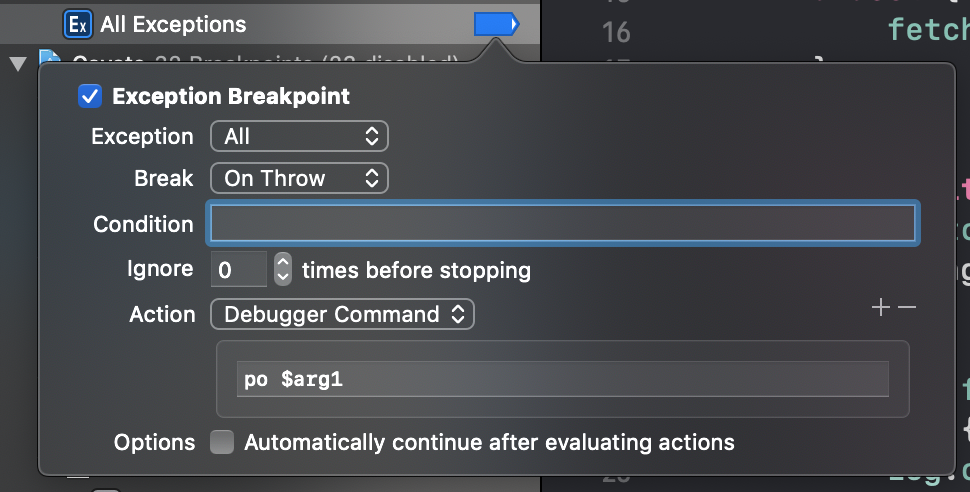
Of course, now you’ll directly make this a user-defined breakpoint so you don’t have to create this one every time you create a new Xcode project!
4: Symbolic breakpoints
We are often helped during debugging with messages in the console telling us to create a symbolic breakpoint. Probably one of the most known ones is the auto layout related symbolic breakpoint:
// Will attempt to recover by breaking constraint
<NSLayoutConstraint:0x600000d7aad0 UIView:0x7fbe55e95420.leading == UILabel:0x7fbe55e95d20.leading + 8   (active)>

// Make a symbolic breakpoint at UIViewAlertForUnsatisfiableConstraints to catch this in the debugger.
Symbolic breakpoints are triggered when a specific method or function is called. They can be added from the breakpoints navigator:
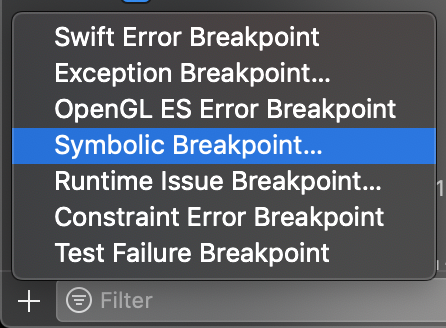
You fill in the keyword in the breakpoint and whenever the symbol is called it will pause your application to start debugging.
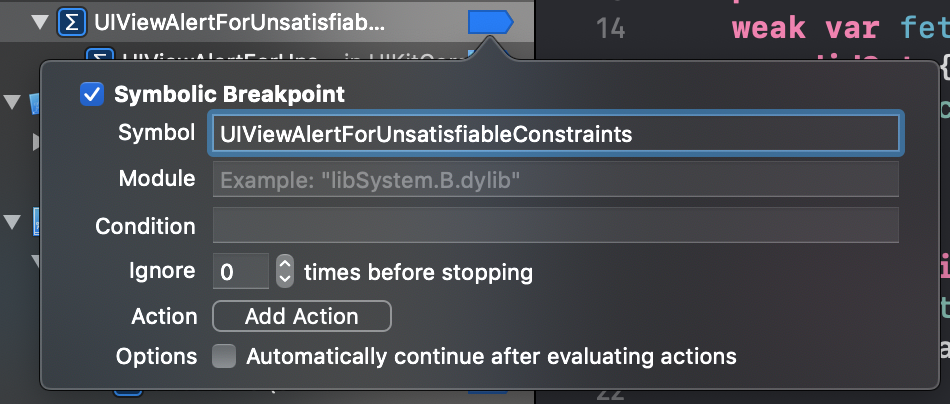
In this specific case, it allows you to navigate quickly to the code that activated the unsatisfiable constraints. Pretty neat!
But isn’t this the constraint error breakpoint?
Surprisingly enough, these errors are not triggering the constraint error breakpoint. According to this thread on the Apple forums, this breakpoint only works for AppKit.
Useful symbolic breakpoints to use for collection view layout debugging
Creating a breakpoint like above but using the UICollectionViewFlowLayoutBreakForInvalidSizes symbol allows you to debug any layout issues with the collection view flow layout. Although it’s still not easy to debug those kinds of issues it will at least point you in the right direction and give you a starting point for debugging.
5: Catching failing tests with a test failure breakpoint
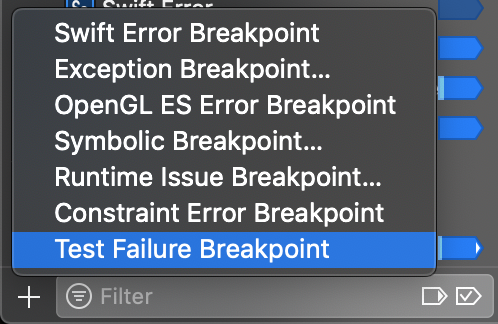
When a test fails you often start navigating through the list of tests to find your failed test. Although this is doable, it’s not really efficient if you’re in your flow. For that, we have the test failure breakpoint which will directly jump to the failed assertion in a test, allowing you to directly start fixing the failed test.
Conclusion
That’s it! 5 tips to make better use of breakpoints. Together with debugging breakpoints as a replacement for prints, this is a great way to speed up your debugging workflow.
If you like to learn more tips on debugging, check out the debugging category page. Feel free to contact me or tweet to me on Twitter if you have any additional tips or feedback.
Thanks!